 CallerHub
For management
How well do your customers really reach you? CallerHub answers with a few clear figures – per team, site and group, from your phone system's call records, without leaderboards.
One look. And you know where it hurts.
Every figure is explained and traceable: the data basis shows the calls behind it. Sample values from CallerHub's test data, last 30 days.
Share of calls answered. The most important figure for customers.
Customers instead of calls: someone who calls three times and then reaches someone counts once.
Share of calls answered within 20 seconds – as in the common 80/20 target.
Share of missed callers who were called back within 24 hours or reached later.
How long it rings until someone picks up – per day, time of day and team.
Missed callers of the last 7 days without a callback – with “Take over” so nobody calls twice.
Plus: missed calls by time of day, “Why missed?”, good moments, quiet times, world map and live view.
Lead with figures that motivate.
- Teams side by side: customers reached, team goal, thanks in the team, called back – alphabetical, never as a ranking.
- Management sees totals: team leads and management see figures for the team, site and group. Individual figures are visible only to the person themselves.
- Recognition made easy: praise suggestions with a concrete occasion and a thank-you wall.
- Own goals: employees choose their goal themselves; only they can see it.
Reports per employee are subject to co-determination; with “Analyse employees anonymously”, CallerHub hides names and goals.


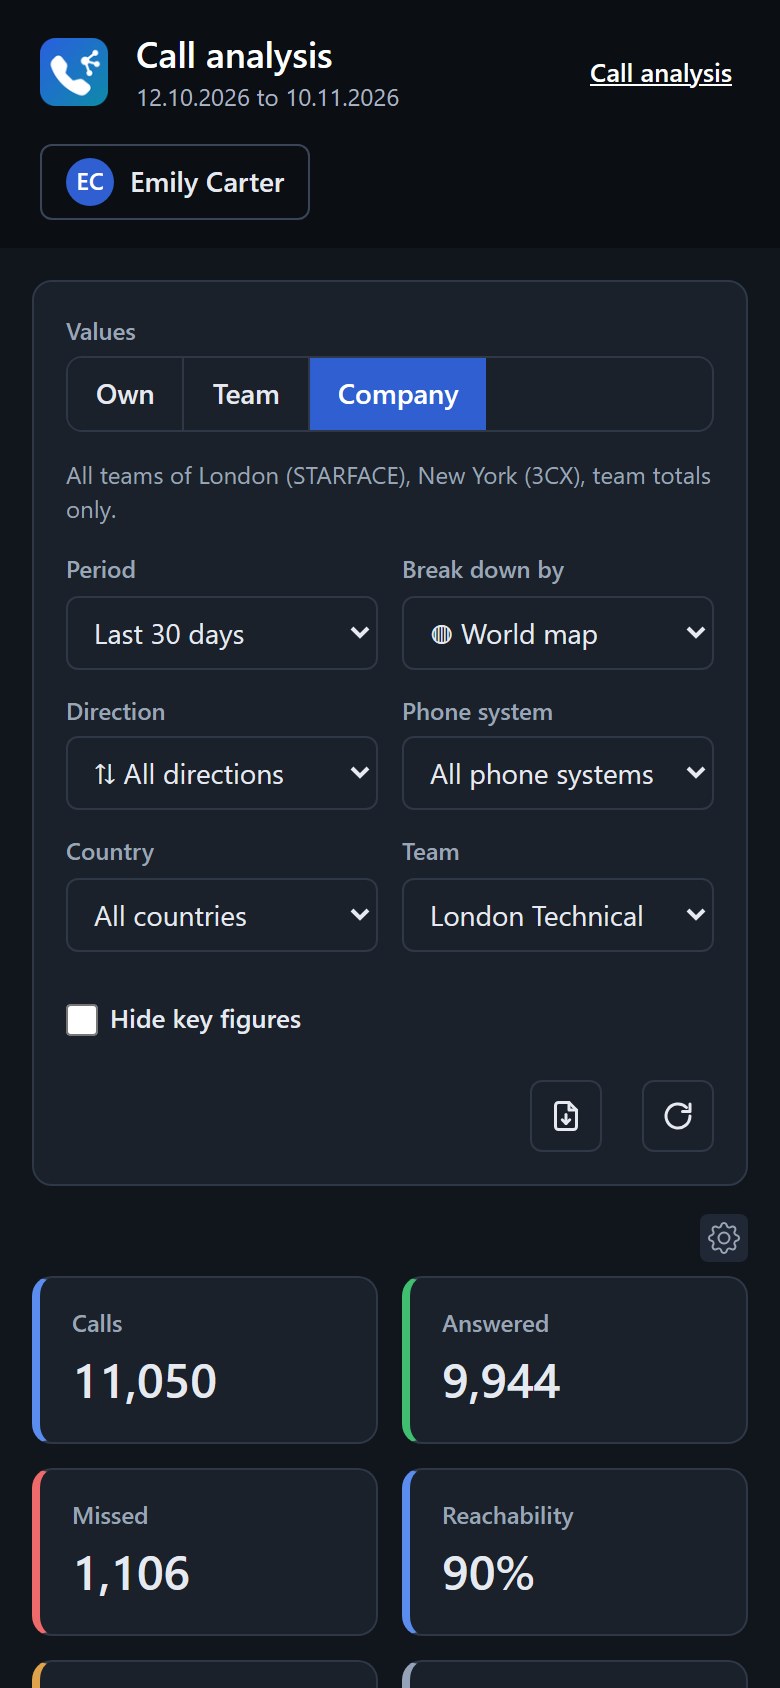
Watch live. Read weekly.
The live view shows who is waiting right now and how the day is going – on the office screen or on the go in the browser. Scheduled reports arrive daily, weekly or monthly as PDF by e-mail, with a weekly review and thanks to the team.
All reports. Ready to browse.
Swipe or use the arrows – every view comes straight from the app (test data).


No cloud project. No privacy headaches.
Start for free
Basic edition free, also for business use; a 30-day trial of the full edition, requested in the app.
Stays in-house
Runs on your own Windows server. No telemetry, no data sent to the provider.
Fits your phone system
STARFACE, 3CX, Asterisk, Mitel and many more – no need to change the phone system.
For every site
Several phone systems, companies and countries in one report; the world map shows where customers call from.
What does a missed call cost in your business?
Enter your own figures. The result is plain arithmetic – no assumptions are built in, nothing is saved or sent.
Your own figures instead of sample values.
CallerHub also analyses exported call records, i.e. retroactively. Tell us which phone system you use – we will tell you how to get your first figures.